01
Management Dashboards
Give decision-makers a clear view of important business activity, pending work, performance, targets, and operational status.
Executive summaries
Department dashboards
Operational KPIs
Pending-work visibility
We develop dashboards, management reports, performance analytics, advanced filters, and downloadable business data around the workflows your organisation actually uses.
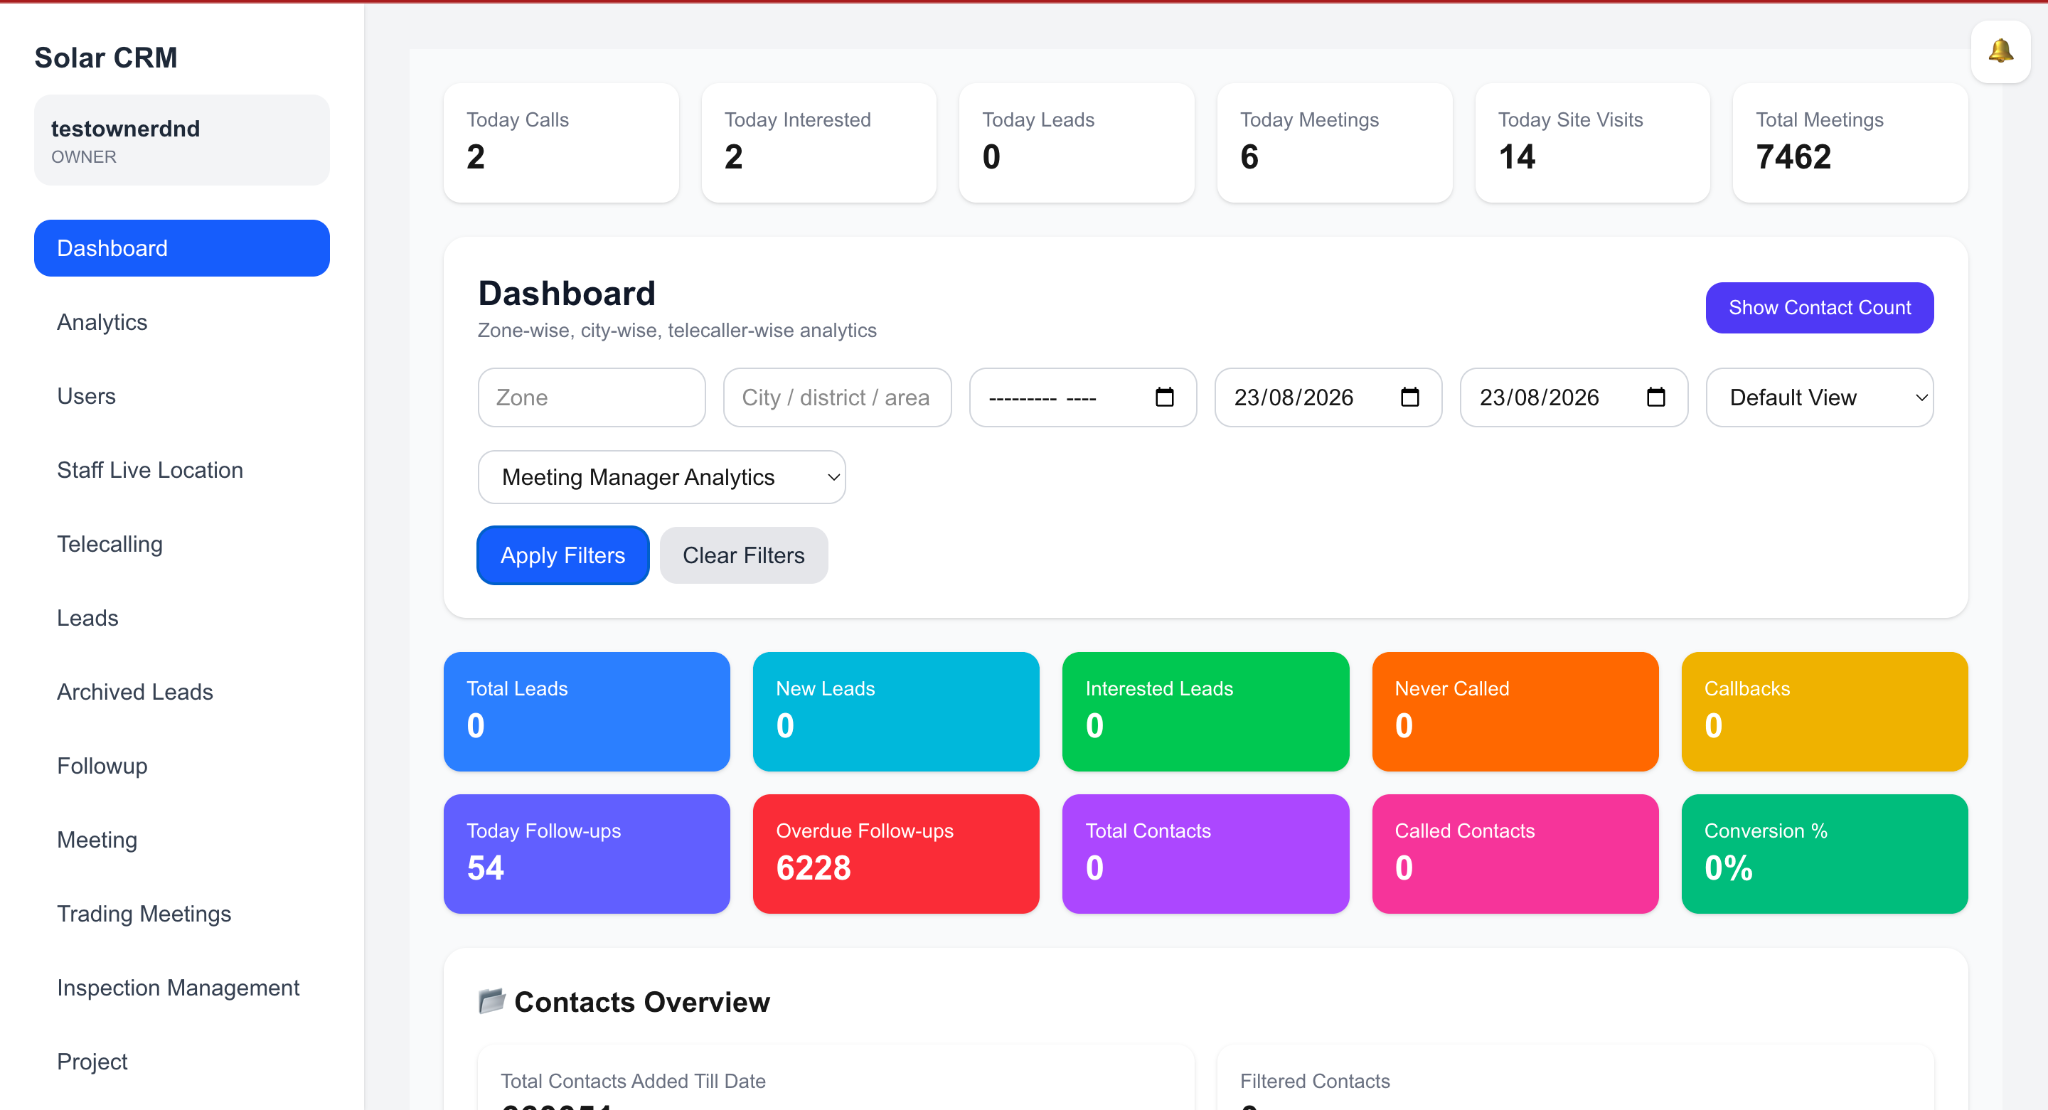
Reporting capabilities
Good reporting starts with the decision a user needs to make, not with adding as many charts as possible.
Give decision-makers a clear view of important business activity, pending work, performance, targets, and operational status.
Measure users, teams, departments, projects, sales activity, workflows, and other business performance through structured reports.
Analyse real business processes such as projects, inventory, procurement, payments, field work, customer service, and task completion.
Allow users to search, filter, segment, and export the exact records required for operations, reviews, or further analysis.
Connected reporting
When a business platform keeps operational data connected, reporting can go beyond isolated department spreadsheets.
Management can view different parts of the organisation through a shared reporting layer while permissions continue to control what each user can access.
One reporting layer
Dashboards and reports become more useful when CRM, ERP, portals, mobile applications, and operational workflows share connected business data.
Use shared sales, project, finance, HR, inventory, customer, and operational data for connected reporting.
Explore →Field and mobile activity can contribute to central reporting when applications use the same connected backend.
Explore →Analytics can help identify overdue actions, bottlenecks, workload, process delays, and automation opportunities.
Explore →Portal activity, service requests, dealer operations, and customer interactions can become part of management reporting.
Explore →Business value
Important business information can be surfaced directly instead of being manually collected from multiple teams or spreadsheets.
Management can understand what is completed, delayed, pending, overdue, or performing below expectations.
Defined report logic reduces dependence on manually prepared reports that may vary between users or departments.
Reports can be designed around decisions and operational actions instead of simply displaying large volumes of raw data.
Reporting design process
01
We first identify what management or operational users actually need to understand, compare, monitor, or act upon.
02
The required customers, projects, transactions, activities, statuses, dates, users, and other records are mapped to the report logic.
03
KPIs, calculations, time periods, user scopes, branch filters, statuses, segments, and export requirements are defined clearly.
04
The reporting experience is implemented around practical usage, with appropriate dashboards, tables, filters, and downloadable records.
Analytics FAQ
Yes. Dashboards can be designed around the specific metrics, workflows, departments, targets, projects, users, and operational information your organisation needs.
Yes. When the required data exists in the CRM, ERP, or connected backend, reports can use that information for management dashboards, operational analysis, and exports.
Yes. Reporting access can be controlled so users, managers, departments, branches, and owners see only the information appropriate to their permissions and responsibilities.
Yes. Reports can support search, date ranges, statuses, users, branches, projects, categories, and other filters before generating downloadable data.
Yes. Where required, filtered records and reporting data can be made available as CSV or spreadsheet-compatible exports.
Yes. KPIs, calculations, filters, dashboards, and reporting requirements can be expanded as business processes and management needs evolve.
Build useful reporting
Start with the metrics, departments, users, filters, calculations, and business questions that matter.